In this article, we’ll show you how to build interactive screen tips for your Excel reports. A great user guide is a key element if you want to enhance the user experience (UX).
The most important function of the interactive screen tips is to tell your story at a higher level using an excel dashboard.
How to build interactive screen tips
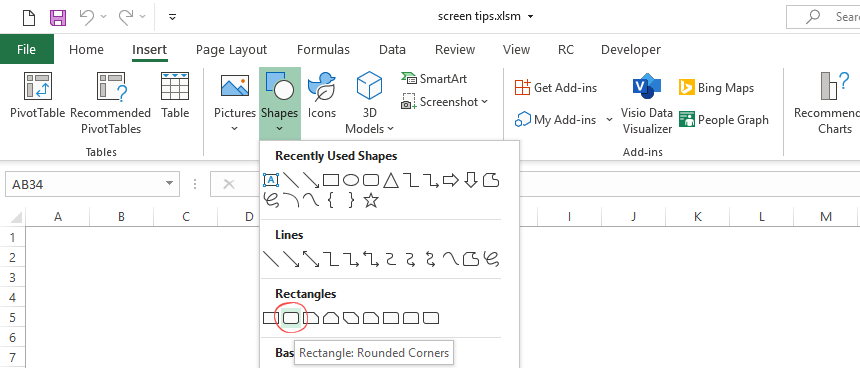
1. Insert a Shape
Go to the Insert tab on the ribbon and select the ‘Shapes’ menu. From the list of the shapes, select and insert a rounded rectangle.
2. Format the screen shape
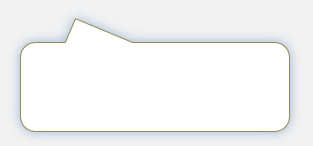
Sometimes the inserted object has some issues, and the shape contains a background or border. In the example, we need a white background and grey text color. To change the style, select the object.
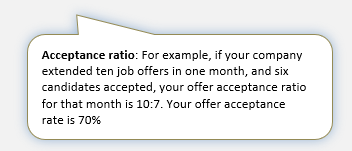
Use the Shape Fill and Shape Outline options to improve the readability. Finally, apply a shadow! After the changes, our box looks like in the picture below:
3. Add Explanation to screen tips
Now, enter the right definition of acceptance ratio: “For example, if your company provides ten job offers in one month and six candidates accepted, the offer acceptance ratio for that month is 10:7. Your offer acceptance rate is 70%.”
4. Group Shapes into one object
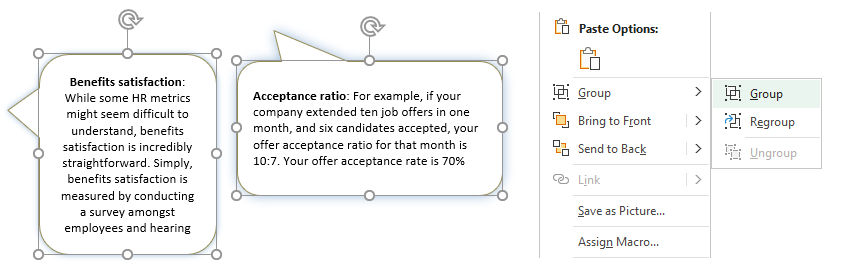
Because I want to use two infoboxes, repeat the above-mentioned steps. If we have two formatted shapes with proper text, follow the steps below:
- To create a group, press and hold the Control key and select all rectangles.
- Right-click and select the Group option from the context menu.
- Click on the Group command to merge the boxes into one object.
You can see the action in the picture below:
5. Name the Group
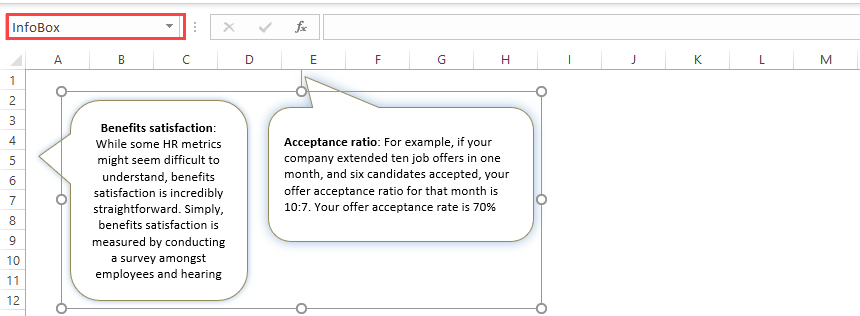
Our screen tip is almost ready. Only a few steps remain: to add a name for the merged objects. To do that, select the group. Locate the Name Box field. The Name Box appears on the top-left corner in Excel. Try to use a simple but proper name. We’ll use it in our VBA code.
In the example, we’ll add the name ‘InfoBox’ for the group.
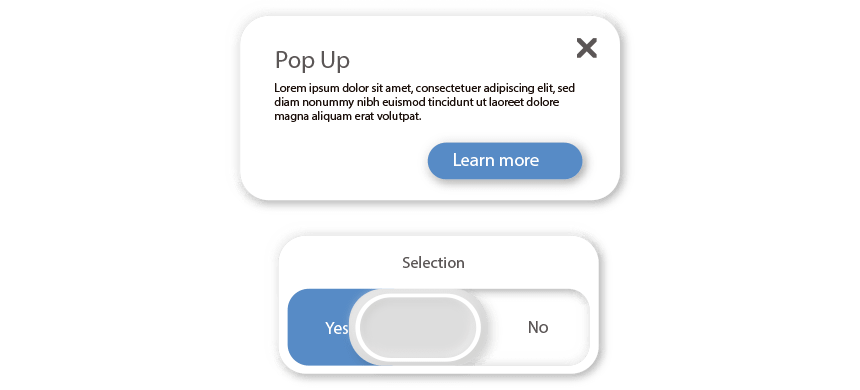
6. Insert a switch button for the screen tips
Insert an icon for the switch button. You can use Microsoft Excel’s built-in icon library. Go to the Insert tab and insert an icon.
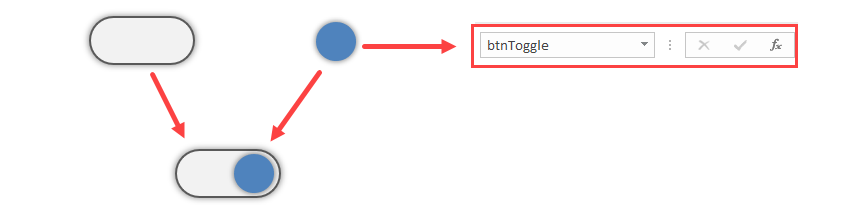
To improve the report’s usability, we’ll create an animated switch button. Insert two shapes! The next step is to add a name for the blue toggle button. In this case, ‘btnToggle’
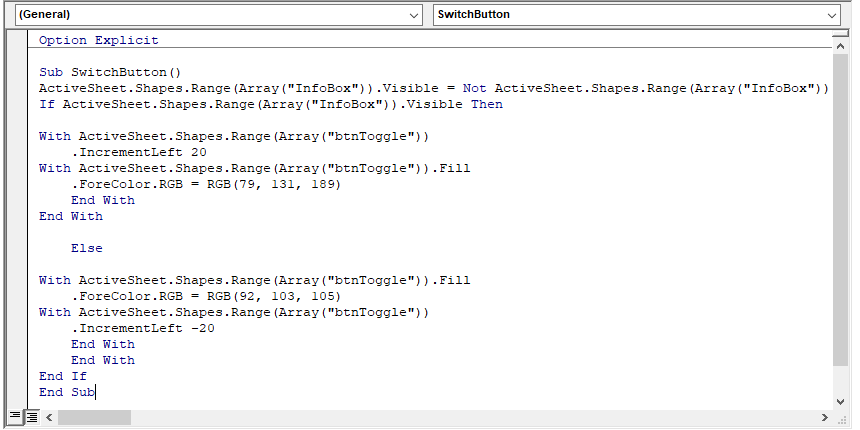
7. Write a VBA code
We want to animate the button! Create a small VBA engine to move the button. This trigger will show or hide the screen tips and change a button’s color from grey to blue. If the marker is blue, the screen tips are active. Elsewhere, the button is grey, and the contextual help remains hidden.
To reach the VBA editor, press Alt + F11. Create a new standard module and add the code below.
8. How the Screen Tips works
To animate the button, we will assign the code to the shape. To do that, right-click on the object! Choose ‘Assign Macro’ from the context menu.
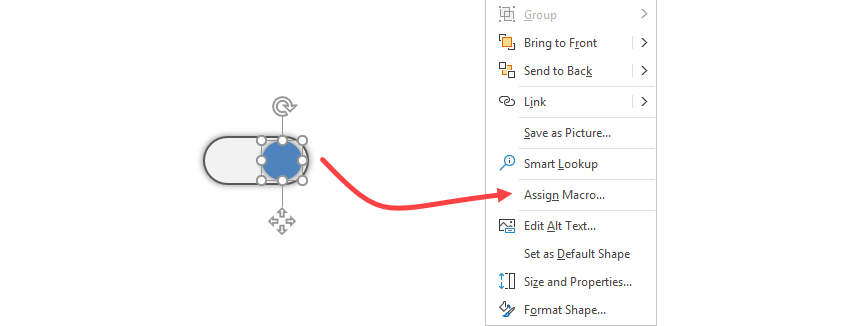
Select the ‘Assign Macro’ option. A new window appears. Select the ‘SwitchButton’ macro and assigns it to the button by clicking OK.
Additional resources: