To count unique values in a list or range, use the UNIQUE function and configure the function’s third argument to TRUE.
In Microsoft 365 for Excel, you can create powerful Excel Formulas. Today’s guide will show you how to count unique and distinct values in a range using COUNT and UNIQUE functions.
Differences between unique values and distinct values
Before we start, we must consider the differences between unique and distinct values.
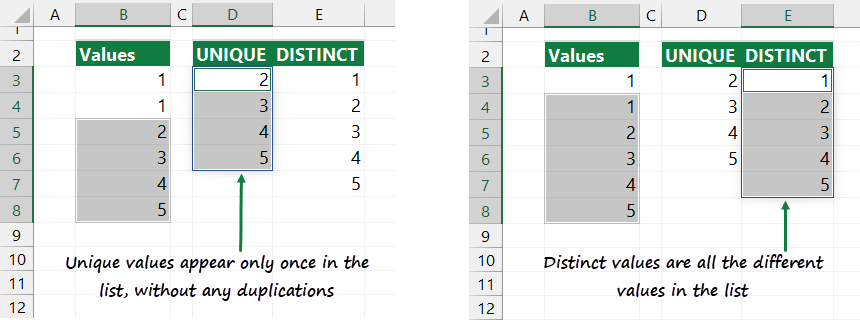
Unique values do not contain duplications; we call a value unique if it appears once (only once) in a range. We think of distinct values when the list contains only the different values in an array or list.
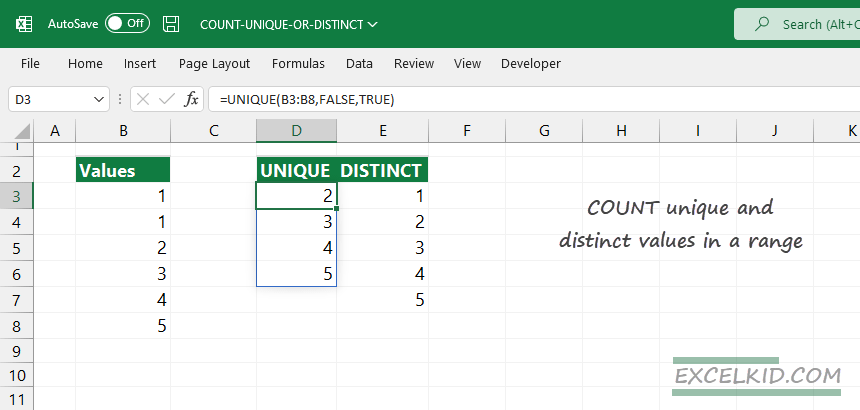
The list below contains a range of values. To make the difference clear, we are using a simple example:
The data set contains the following values:
={1, 1, 2, 3, 4, 5}If you want to count unique values in this range, you can do that based on the above definition. As you see, 1 is not a unique value.
={2, 3, 4, 5}Here is the array that contains only different values; here is the list of distinct values:
={1, 2, 3, 4, 5}It is easy to count these values because we are working with a small array. The next chapter will show you how to create a formula that uses COUNTIF and UNIQUE functions.
Count unique values using the UNIQUE function
In the first example, we want to identify the unique and distinct values first, then count all matching values.
Unique values in rows or columns
If you want to create a list that contains unique values, set the 2nd argument to FALSE and use TRUE as the 3rd argument of the UNIQUE function. Finally, the COUNT function counts unique values in the given column.
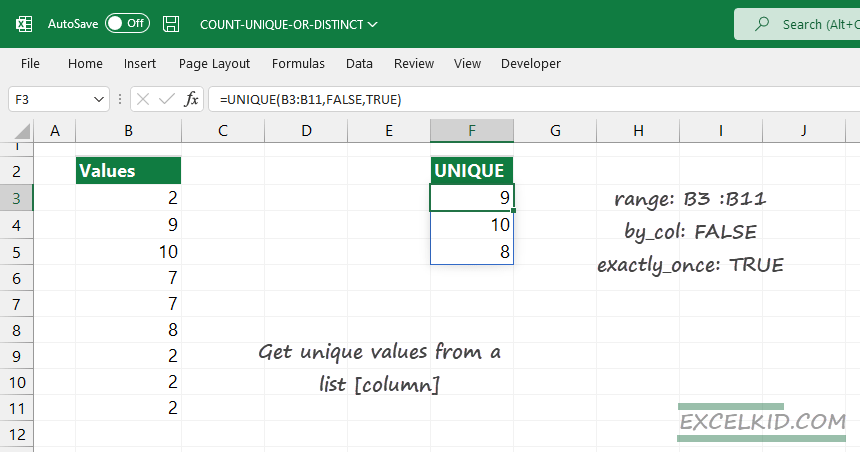
Enter the formula in cell F3:
=UNIQUE(B3:B11, FALSE, TRUE)
=COUNT(UNIQUE(B3:B11, FALSE, TRUE)) //returns 3
To count unique values in a row, configure the UNIQUE function’s arguments like this:
- array: C2:K2
- by_col: TRUE
- exactly_once: TRUE
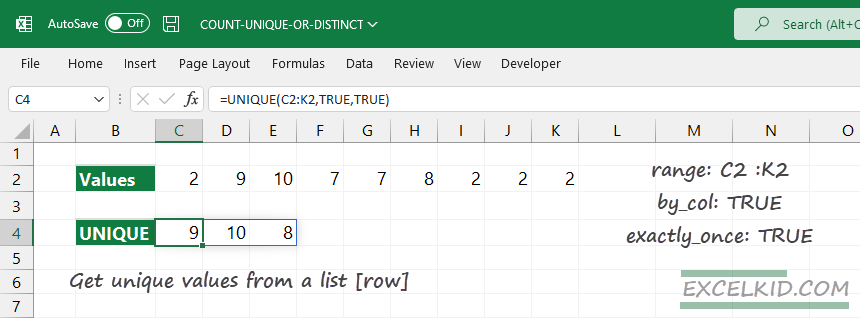
The formula in cell C4:
=UNIQUE(C2:K2, TRUE, TRUE)
=COUNT(UNIQUE(C2:K2, TRUE, TRUE)) //returns 3
Distinct values in rows or columns
In the following two examples, we will count the distinct values in a row or a column. Set the UNIQUE function 2nd and 3rd arguments to FALSE to get distinct values from a column.
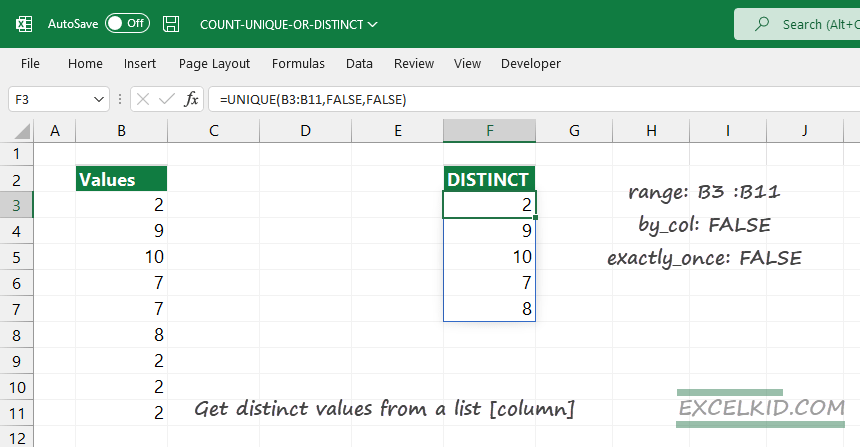
Enter the formula in cell F3:
=UNIQUE(B3:B11, FALSE, FALSE)
=COUNT(UNIQUE(B3:B11, FALSE, FALSE)) //returns 6
Now, modify the formula to get distinct values from a row.
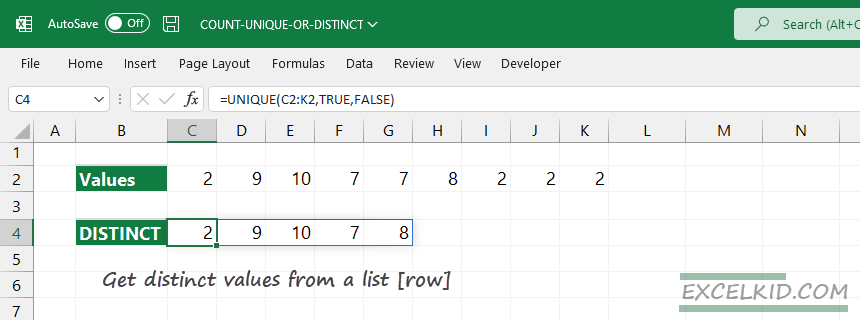
The 2nd argument is TRUE; the 3rd argument is FALSE.
=UNIQUE(C2:K2, TRUE, FALSE)
=COUNT(UNIQUE(C2:K2, TRUE, FALSE)) //returns 6
Count unique values in a range
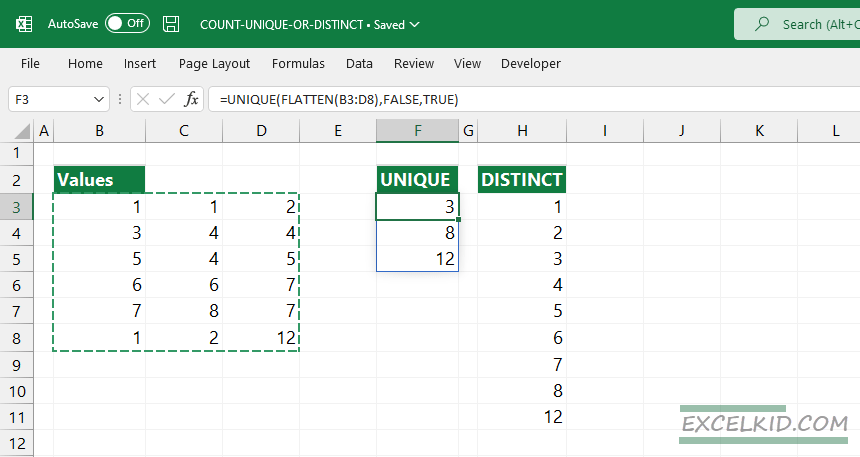
The UNIQUE function works fine if you are looking and counting unique or distinct values in a column or a row. What if we have a range that contains multiple rows and columns?
Update: You can flatten multiple ranges using the TOCOL and TOROW functions.
FLATTEN function in Excel (Workaround)
FLATTEN function is currently missing in Microsoft Excel; the function is available only in Google Sheets. The main advantage is that the FLATTEN function flattens values into a single column. We are waiting for the native support for Excel.
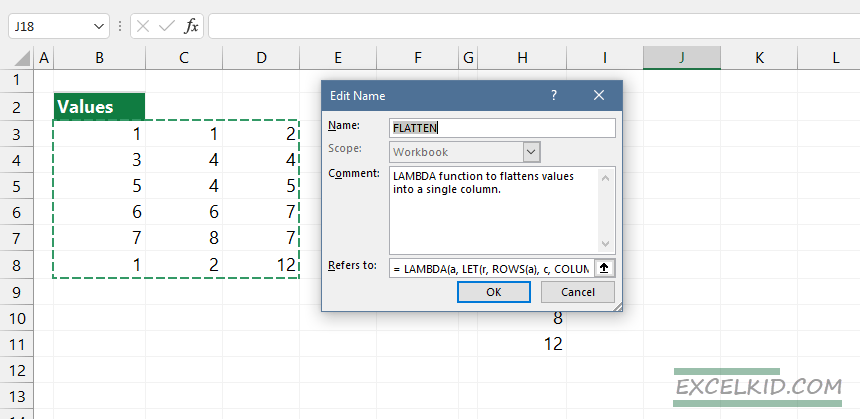
We use the LAMBDA function to create the same functionality in Excel.
First, copy the following expression to the Clipboard.
= LAMBDA(a,LET(r,ROWS(a),c,COLUMNS(a),idx,SEQUENCE(r*c),INDEX(a,ROUNDDOWN((idx-1)/c,0)+1,MOD(idx-1,c)+1)))Press the Ctrl + F3 keyboard shortcut to open the Name Manager. Add a new name to a name box. As an optional step, enter a short, descriptive comment. Finally, locate the ‘Refers to:‘ section and paste the LAMBDA formula. Click OK to save the new Excel-compatible FLATTEN function.
Download the practice Workbook that contains the new function. We hope you will be familiar with unique and distinct values from now. We will eliminate all LAMBDA formulas and replace them with powerful user-defined functions. Stay tuned.
Related Formulas
- Count unique text values in a range