Learn how to calculate probability in Excel using the PROB function with or without the upper limit.
Table of contents:
- What is probability?
- How to calculate probability in Excel
- The PROB function
- Basic Example
- Use the PROB function without any upper limit
What is probability
Probability measures how likely an event is to occur or how likely a proposition is true. The higher the likelihood of an event, the more likely it is that the event will occur.
How to calculate probability in Excel
We measure probability through the ratio of favorable events to the total number of possible occurrences. Excel uses the PROB statistical function.
For the sake of simplicity, here is the simple definition.
= number of desired outcomes/number of possible outcomes
In the case of six-sided dice, the chance to roll the “6” is = 1/6 = 16.67%.
The PROB function
In this section, we’ll introduce the Excel PROB function. With its help, you can calculate the probability using a built-in spreadsheet function.
Syntax and Function Arguments
=PROB(range, prob_range, [lower_limit], [upper_limit])
where
- x_range: the range that contains numerical values
- prob_range: the range that contains probabilities for each corresponding value
- lower_limit [optional]: the lower limit of the values
- upper_limit [optional]; the upper limit of the values
Basic Example of calculating probability in Excel
In the following example, first, prepare our table.
Range C3:C6 contains the number of orders in a period. In range D3:D6, you can find the probabilities for each order. Finally, the lower limit is 1500, while 2000 is the upper limit in cell G3.
In this case, we’ll use all four arguments of the PROB function.
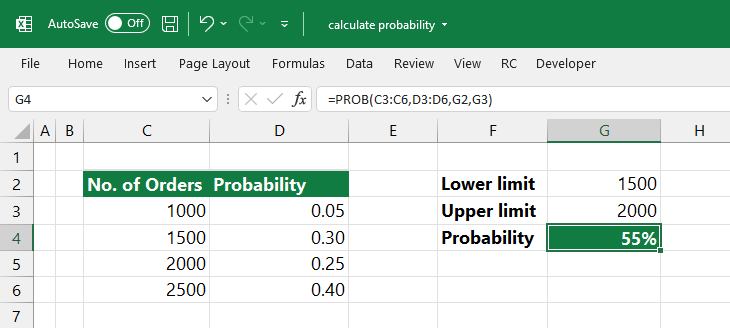
Type the formula in cell G4:
=PROB(C3:C6, D3:D6, G2, G3)
The result is 55%. What did this mean?
The probability that the number of orders between 1500 and 2000 is 55%.
Tip: If you have faced errors when calculating probability in Excel, look closely at your data. Prepare data to avoid further issues: The sum of all probabilities should equal 1 (or 100%). In the example, you can apply this check for column D.
It’s worth double-checking our data: SUM(D3:D6) = 1 = 100%
Calculate the probability without any upper limit
The following example will explain what happens if you are not using upper limits to calculate the probability in Excel.
The PROB function returns the probability that is equal to the selected lower limit.
Use the formula below:
=PROB(C3:C6,D3:D6,G2)

So, without using the same data set without an upper limit, the result is 2500.
Tip: Only three arguments are necessary if you use the function without an upper limit.
Wrapping things up
In some cases, the Excel PROB function returns an error:
- If any value in prob_range is not greater than equal to 0 or greater than 1, the function returns the #NUM! error.
- The sum of the values in the prob_range must be equal to 1. Otherwise, PROB functions get the #NUM! error.
- The number of values in the prob_range and the x_range should be equal.
Additional resources: